

The Timeless Tool: GNU Debugger on Linux
Debugging lies at the core of software development, serving as a crucial skill for programmers and security researchers alike. The GNU Debugger, fondly known as GDB, stands as a stalwart in the debugging arena, having been a reliable companion for programmers over the years. As we embark on this journey to explore the nuances of GDB on Linux, you’ll unlock the power to enhance your code quality and unearth hidden bugs.
Preparing Sample Programs: Setting the Stage for Exploration
Before delving into the intricacies of GDB, it’s essential to set the stage for experimentation. This section introduces the concept of sample programs, executable entities that will serve as our testing ground. We’ll run GDB through its paces by examining these sample programs, each designed to showcase different scenarios: from source code availability to multithreaded programs.
In this process, you’ll witness how the compilation of these programs plays a pivotal role. The compilation command adorned with the -g flag to enable debug symbols becomes a recurring theme, laying the foundation for effective debugging.
Running a Program in GDB: Initiating the Debugging Dance
With our stage set and sample programs in hand, it’s time to let GDB take the center stage. This section demystifies the art of running a program within the confines of GDB. You’ll become well-versed in the nuances of executing a program, whether by directly invoking GDB with the program’s name or by loading the program into GDB before running it.
The intricacies of incorporating command-line arguments seamlessly into the debugging process emerge, ensuring that your debugging environment mirrors real-world scenarios closely. Armed with this knowledge, you’ll navigate the initial steps of the debugging dance with confidence.
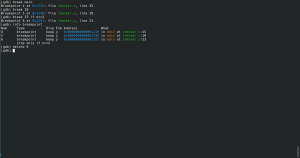
Setting Breakpoints With GDB: Pausing the Performance
Breakpoints emerge as vital signposts in the debugging journey, allowing you to halt the flow of execution at specific junctures. This section delves into the art of strategically placing breakpoints to gain deeper insights into your code’s behavior. Whether it’s halting execution at a particular function or a specific line number, GDB equips you with tools to dissect program behavior.
Moreover, you’ll uncover the potential of conditional breakpoints, introducing an element of flexibility that empowers you to pause execution based on specific conditions. This feature opens doors to dynamic debugging scenarios, revealing intricacies that might otherwise remain concealed.
Stepping Through Code: Unraveling the Execution Thread by Thread
Understanding how your program processes data is essential, and stepping through code provides you with a front-row seat to this intricate dance. In this section, you’ll master the art of traversing your code with precision. The three primary methods—step, next, and finish—allow you to dissect program behavior at different granularities.
These techniques empower you to grasp how your code’s logic is implemented, pinpointing not only the root of crashes but also the essence of how your code interacts with data. Armed with these insights, you’ll navigate complex code paths with surgical precision, honing your debugging skills to perfection.
Examining Variables: Shedding Light on the Shadows
As you journey through your code, a crucial aspect emerges: variable values and their dynamic changes. In this section, you’ll uncover methods to peer into the shadows of your program’s execution, illuminating the values of variables as they metamorphose during runtime.
The print command becomes your ally, providing real-time insights into the values that define your program’s behavior. Moreover, the display command takes your understanding a step further, enabling you to track and print variable values, especially useful within loops or recursive functions. This insight-laden process paves the way for comprehending the intricate dance between code and data.
Setting Watchpoints: Vigilance Amidst Change
Change is a constant in the world of programming, and monitoring this change is vital to effective debugging. Enter watchpoints—an indispensable tool in your debugging arsenal. In this section, you’ll explore the technique of tracking changes within your code, halting execution whenever a variable’s value undergoes transformation.
With the watch command at your disposal, you can ensure that you’re always one step ahead of unexpected changes, catching bugs at their inception. This proactive approach to debugging not only saves time but also elevates your code quality to new heights.
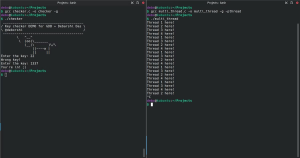
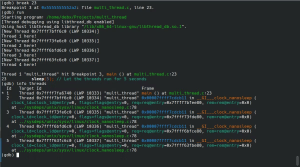
Thread-Specific Debugging With GDB: Unveiling Multithreaded Mysteries
Multithreaded programs add a layer of complexity to debugging, and this section equips you with the tools to navigate this intricate landscape. Through a practical example involving a simple C program with multiple threads, you’ll unravel the mysteries of thread-specific debugging.
Discover how to isolate threads, inspect their execution flows, and gain insights into their behavior. Armed with this knowledge, you’ll confidently unravel the intricacies of multithreaded programs, ensuring smooth execution even in the most complex scenarios.
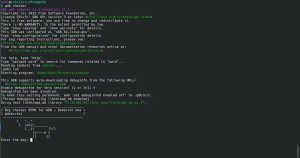
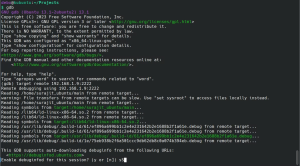
Remote Debugging With GDB: Bridging Geographical Gaps
Sometimes, the need to debug extends beyond your local machine. Enter remote debugging—an essential technique for troubleshooting programs located on different systems. This section guides you through the process of setting up and leveraging gdbserver, the bridge between your debugging environment and remote systems.
With practical installation steps and connection procedures, you’ll seamlessly extend your debugging prowess across geographical boundaries. The ability to remotely debug broadens your toolkit, making you a versatile programmer capable of tackling challenges regardless of location.
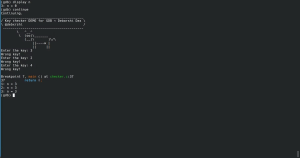
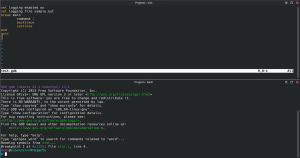
Writing GDB Scripts to Automate Debugging: Scripting Your Debugging Symphony
Efficiency meets automation in this section, as you delve into the world of scripting GDB commands. Repetitive debugging tasks meet their match as you learn to create GDB scripts, automating sequences of commands that expedite the debugging process.
With a practical example at your fingertips, you’ll witness the orchestration of a debugging symphony through a script. By the end, you’ll be equipped to streamline your debugging workflow, maximizing productivity and minimizing redundant efforts.
Conclusion: Empowering Your Debugging Odyssey
As this comprehensive journey through the intricacies of GNU Debugger on Linux concludes, you stand at the precipice of empowered debugging. Armed with insights spanning sample program preparation, execution, breakpoints, variable examination, multithreaded debugging, and more, you possess a versatile skill set that will drive your programming endeavors.
The GNU Debugger emerges not merely as a tool but as a beacon guiding you through the labyrinth of code, illuminating paths to improved code quality and bug-free programming. Your newfound expertise propels you into the realm of proficient programmers and effective problem solvers, forever transforming the way you approach debugging challenges. Embrace this knowledge, for it is the key to unlocking the full potential of your programming journey.
Key Points at a Glance:
| Topic | Description |
|---|---|
| Preparing Sample Programs | Compile with -g flag for debug symbols |
| Running a Program in GDB | Use gdb <program> or gdb, file <program> |
| Setting Breakpoints With GDB | Basic breakpoints and conditional breakpoints |
| Stepping Through Code | step, next, and finish commands |
| Examining Variables | Use print <variable> and display <variable> |
| Setting Watchpoints | Track changes in data with watch <variable_name> |
| Thread-Specific Debugging | Debug multithreaded programs with info threads and thread commands |
| Remote Debugging With GDB | Debug programs on remote systems using gdbserver |
| Writing GDB Scripts | Automate debugging with GDB scripts |
Comparative Table: Debugging Tools
| Feature | GNU Debugger (GDB) | WinDBG (Windows Debugger) |
|---|---|---|
| Platform | Linux | Windows |
| Debug Symbol Support | Yes | Yes |
| Multithreaded Debugging | Yes | Yes |
| Remote Debugging | Yes | Yes |
| Scripting Support | Yes | Yes |
| Community Support | Strong community support | Strong community support |